It seems that each NHS planning round inspires me to produce yet another Excel Bridge template.
The powers that be seem to love the visual appeal of a colourful waterfall and I find that pulling the data together for a detailed bridge makes the pain of completing the Source and Apps, TRU64 templates, marginally less painful.
This year’s template allows you to prepare what I refer to as the Double Bridge. It’s a waterfall chart with two start points and two end points. It’s probably easier to understand what I’m talking about with an example income bridge.
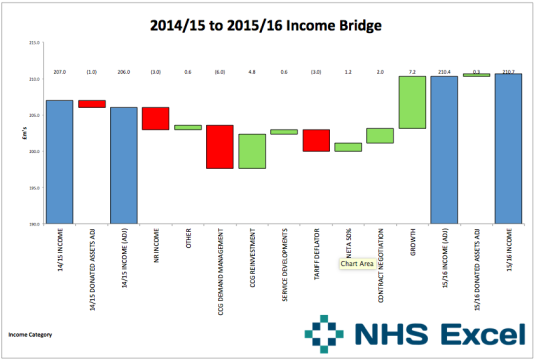
What I’m doing here is showing the starting income position (14/15 forecast), then I’m making an adjustment for donated assets and then restating the starting position after the donated assets correction. You then have the standard waterfall taking you through to the adjusted 15/16 forecast position and the second bridge showing the donated assets impact and final non-adjusted position.
I’ve attached the Excel Bridge template, which includes an income bridge, expenditure bridge and position bridge. They contain dummy figures and I haven’t connected them together, so the position bridge data isn’t a composite of the income and expenditure bridges.
I’ve previously prepared a really detailed tutorial explaining how bridge diagrams are built, if you follow this first you should find it fairly easy to unpick this slightly more complex version by looking at the formulas in columns D:G